Our 2018 Transition to Teaching survey shows an improved job market for early-career teachers in Ontario.
French as a Second Language and French-language teachers continue to be in high demand, confirming widely recognized shortages of members holding these qualifications across the province.
Early-career English-language graduates also report better job outcomes as the pool of unemployed teachers from a recent surplus quickly recedes.
Ontario will need more teachers in the years ahead to fill anticipated classroom vacancies across the province. The current forecast suggests the new supply is not enough to meet this need.
Although their numbers are lower than in previous years, unemployed Ontario graduates and Ontario-licensed teachers educated in other jurisdictions may help school boards meet their recruitment goals in the coming years. Graduates who moved out of province during the surplus may also help, as long as school board hiring conditions allow their return.
The increase in Ontario faculty of education applications in 2018 shows promise that a new generation of teachers will be ready to meet board hiring requirements.
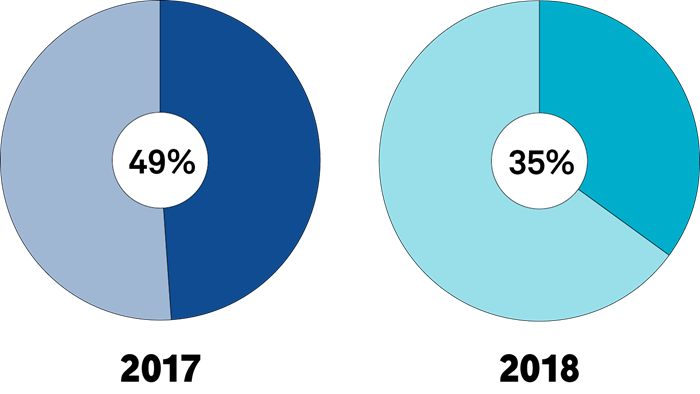
Despite a stronger job market, some early-career teachers find it difficult to move from daily occasional rosters to permanent contracts. This is especially true for English-language program graduates who do not hold a French as a Second Language qualification. Less than one in three of these teachers in English-language school boards hold permanent positions after five years, compared to more than 80 per cent of French-language program graduates and French as a Second Language teachers.
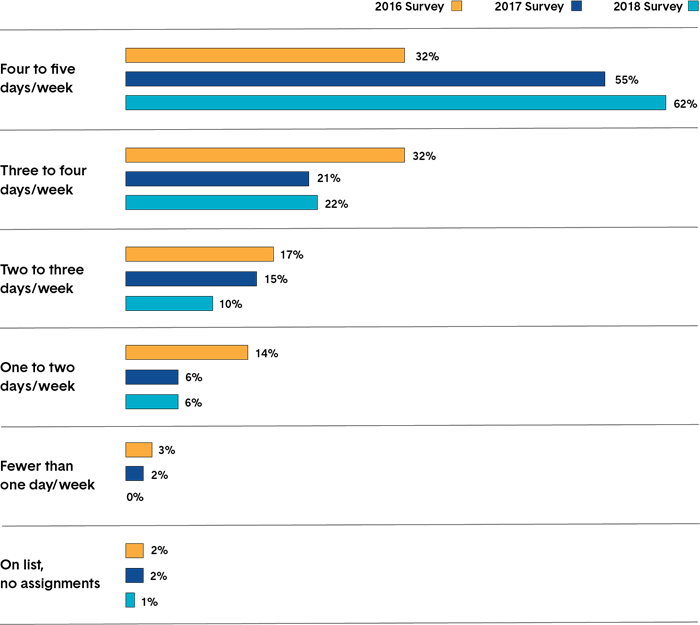
Although occasional teaching continues to be the norm for early-career teachers and English-language teachers, first-year teachers are now experiencing better access to occasional rosters earlier in the school year, and to more daily teaching assignments per week.
New teachers licensed annually in Ontario
The reduction from 2015 to 2016 in teachers licensed annually was due to the introduction of the four-semester enhanced teacher education program.
2018 to 2020 forecast: 5,600 per year
2017: 5,551
2016: 3,600
2006 to 2015: 11,587 per year
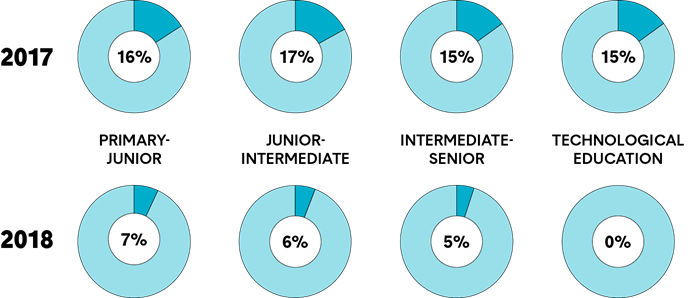
Unemployment rates for first-year teachers
Primary-Junior: 16% in 2017 and 7% in 2018
Junior-Intermediate: 17% in 2017 and 6% in 2018
Intermediate-Senior: 15% in 2017 and 5% in 2018
Technological Education: 15% in 2017 and 0% in 2018
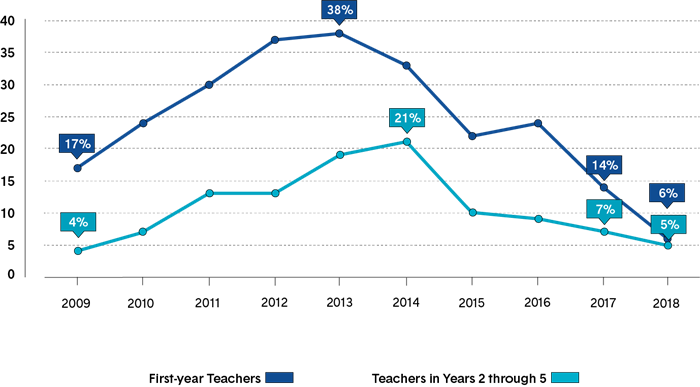
Unemployment rates for early-career teachers
2009: 17% for first-year teachers and 4% for teachers in years 2 through 5
2010: 24% for first-year teachers and 7% for teachers in years 2 through 5
2011: 30% for first-year teachers and 13% for teachers in years 2 through 5
2012: 37% for first-year teachers and 13% for teachers in years 2 through 5
2013: 38% for first-year teachers and 19% for teachers in years 2 through 5
2014: 33% for first-year teachers and 21% for teachers in years 2 through 5
2015: 22% for first-year teachers and 10% for teachers in years 2 through 5
2016: 24% for first-year teachers and 9% for teachers in years 2 through 5
2017: 14% for first-year teachers and 7% for teachers in years 2 through 5
2018: 6% for first-year teachers and 5% for teachers in years 2 through 5
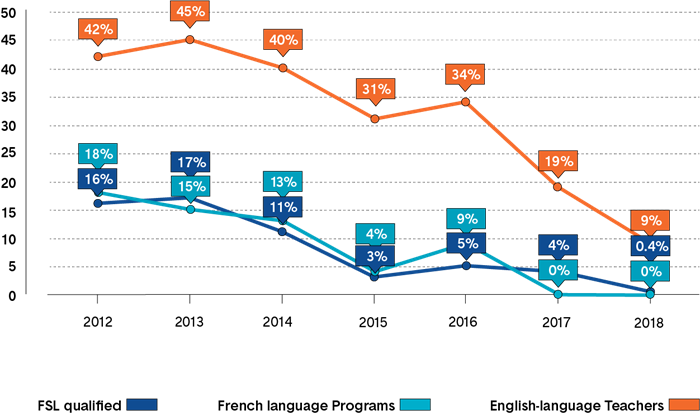
Unemployment rates for Ontario-resident first-year teachers by language of qualification
2012: FSL qualified was 16%.
French-language programs was 18%.
English-language teachers was 42%
2013: FSL qualified was 17%.
French-language programs was 15%.
English-language teachers was 45%
2014: FSL qualified was 11%.
French-language programs was 13%.
English-language teachers was 40%
2015: FSL qualified was 3%.
French-language programs was 4%.
English-language teachers was 31%
2016: FSL qualified was 5%.
French-language programs was 9%.
English-language teachers was 34%
2017: FSL qualified was 4%.
French-language programs was 0%.
English-language teachers was 19%
2018: FSL qualified was 0.4%.
French-language programs was 0%.
English-language teachers was 9%
Unemployment rate for teachers who are new to Canada
Percentage of teachers with permanent teaching contracts
French-language district board: 52% for year 1, 83% for year 3 and 86% for year 5
FSL-qualified in English district board: 29% year for 1, 60% for year 3 and 83% for year 5
English-language teacher, English district board: 2% for year 1, 16% for year 3 and 30% for year 5
Employment frequency of Ontario-resident first-year daily occasional teachers
4 to 5 days per week: 32% in the 2016 survey, 55% in the 2017 survey and 62% in the 2018 survey
3 to 4 days per week: 32% in the 2016 survey, 21% in the 2017 survey and 22% in the 2018 survey
2 to 3 days per week: 17% in the 2016 survey, 15% in the 2017 survey and 10% in the 2018 survey
1 to 2 days per week: 14% in the 2016 survey, 6% in the 2017 survey and 6% in the 2018 survey
Fewer than one day per week: 3% in the 2016 survey, 2% in the 2017 survey and 0% in the 2018 survey
On list, no assignments: 2% in the 2016 survey, 2% in the 2017 survey and 1% in the 2018 survey
Teaching assignments for first-year occasional teachers